02/01/08 FastBreak - Year 2007 Review
02/01/2008 FastBreak - Year 2007 Review
Before reviewing FastBreak trading system performance for this past year we want to take care of a few housekeeping issues.
Upgrades for FastBreak Pro and Standard FastBreak
We recently put new upgrades (Version 5.4) of FastBreak and FastBreak Pro on our website for Version 5 users. There is a significant benefit for Pro users optimizing with FNU files. FastBreak Pro V5.4 will run the optimizer about 4 times faster. FNU data files load much slower into FastBreak than the data in FastTrack’s databases. Why would you use FNU data? One example is if you use index data to build long term synthetic version of high beta index funds – such as the Rydex or ProFunds high beta funds. The upgrade also fixes a minor bug that can occur on rare occasions. We recommend Version 5 users of Standard FastBreak and FastBreak Pro download the upgrades.
New FastBreak Pro Beta – Automated Trendlines
We have placed a new beta (Version 6.0) of FastBreak Pro on the website. There is no cost to download and try this beta, but it can only be used by Version 5 users. Users of earlier versions of FastBreak Pro will not be able to run the new beta. This new beta version contains an automated Trendline capability. Developing an automated trendline has been one of our long time goals. A detailed description of the capability is available in the release notes on the website that anyone can download.
Trendlines are one of oldest and most used technical analysis tools. Trendlines can be used as stops, i.e., when an equity breaks down through its upward trendline, or trendlines can be used as buy filters, i.e., when an equity breaks above its downward trendline. FastBreak relies on identifying equities that are in a trend that can be traded with a profit. Reliable determination of when a trend has started and when it has ended is key.
There are two major problems with trendlines: One, trendlines are easy to draw “after the fact”, that is to say, it is easy to determine the trendline anchor points in retrospect. The second problem is that although trendlines are easy for the human brain to draw, it is very difficult to develop an automated method. We put considerable effort developing a custom automated algorithm that builds better trading strategies in many cases. The capability allows the user to select either linear or log based trendlines, or the user can let the FastBreak Pro optimizer find the better option.
We would encourage FastBreak Pro version 5 users to download the beta and try it and post their experience or questions on the FastBreak/FastGraph forum of the www.ft-talk.com website.
For information on all our products see FastTrack Commentaries 8160, 8161, 8162, 8163, 8164, 8165, and 8166 and visit www.edge-ware.com
2007 Year in Review
This commentary will review several different types of trading systems.
The first version of FastBreak was released in early 1996. Potential users of any investment software product should always ask the question "What is actual performance?" Soon after the initial release we developed trading systems that could be monitored for "real time" performance. We don't modify trading system parameters during the performance reporting period and report on the systems on a yearly basis. The 2004 - 2006 reviews are available in FastTrack Commentary 8164 - 8166. If you would like to review all reports since 1997 visit our web site www.edge-ware.com and go to the Strategies page.
With the release of Standard FastBreak and FastBreak Pro version 4.0 in late 2001, we have the ability to run the same strategies in the Standard and Pro versions. All of the systems we report on here were developed with the Pro version but can be run in the Standard version.
We place example FastBreak Pro developed trading systems on the Strategy page of our web site. These systems provide users and potential users a starting point on the many different types of trading systems that can be built with FastBreak. It also allows us to provide an honest benchmark for real time performance. Users of both Standard and Pro versions can download these systems. The Standard FastBreak 30 day demo that can be downloaded from the web site can also run these strategies but will not display the last 60 market days of trades. Many of these systems are several years old. We can now build better trading systems, but we keep these systems on our web site to show that many trading systems are effective for long periods of time.
We don’t often post or change the strategies on our web site because we believe investors’ needs are very unique and users of our software should feel confident developing their own trading systems.
The strategies we report on are "out-of-sample/real time” for the entire year and in some cases the strategies have been unchanged for several years.
The 2007 US stock market followed an odd pattern. Rather than the typical strong start, weak middle and strong finish, the market finished the year weak. For only the 8th time in the past 108 years both November and December were down months. The US markets broke from the low volatility of recent years and had three significant, sharp sell offs. Most major stock indexes finished the year positive but with less than spectacular results. Small cap stocks were very weak as indicated by the Russell 2000 which finished the year with nearly a 3% loss. It should be noted that the NASDAQ 100 (NDX-X) had a very good year and was up nearly 19%. This was due in part to a few large cap members of the index which had returns of well over 100%. Many international markets had an outstanding year.
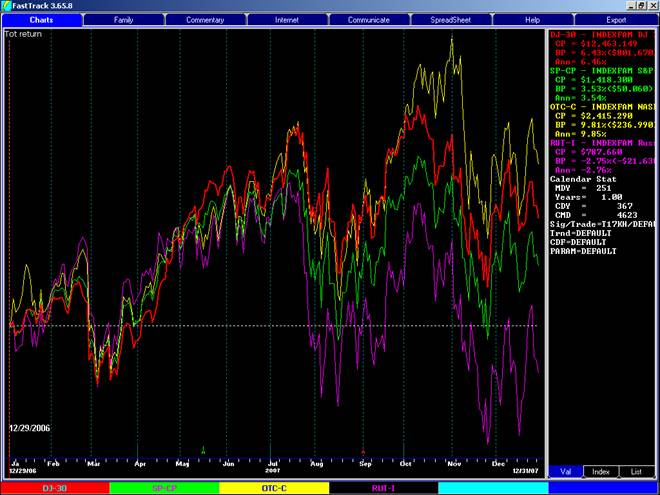
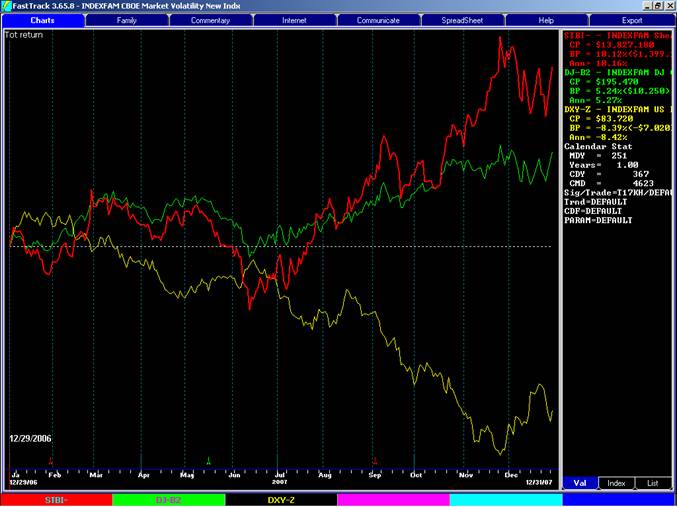
The bond market as measured by Treasuries (STBI-) and Commercial bonds (DJ-2B) had an interesting year. Early in the year there was no clear consensus on if the Federal Reserve would ease or tighten credit. This all became clear in the second half of the year and bonds generally rose; however, Treasuries really took off as a safe haven when many corporate bonds became suspect. The high yield end of the market actually declined as credit concerns spread. As is well known, as US interest rates declined the US dollar became very weak (See DXY-Z in the chart below) FastBreak bond trading systems and systems that take advantage of a weak dollar did a very good job of capturing profit in this market. It should be noted that there are now a number of investment vehicles that allow taking advantage of either a strong or weak US dollar environment.
Here is a summary of common benchmark performance in 2007:
|
|
Return %
|
MDD
|
UPI
|
|
S&P 500
|
3.5
|
-10.1
|
0.5
|
|
DJ-30
|
6.4
|
-10.0
|
1.3
|
|
OTC (NDX 100)
|
9.8
|
-11.1
|
1.9
|
|
STBI- (Treas. Bond Index)
|
10.2
|
-6.2
|
3.74
|
|
DJ-B2 (DJ Bond Index)
|
5.2
|
-3.4
|
2.9
|
|
DXY-Z (Dollar Index)
|
-8.4
|
-12.2
|
-1.6
|
Rapid reversals in many markets during the year made it difficult for many professional money managers. We include two measures of investment returns for professional managers:
|
Return%
|
|
Managed Futures Funds
|
~ 10-12 %
|
|
Hedge funds
|
~ 9-10 %
|
The above values are approximate because of the difficulty obtaining reliable information on these programs. Hedge funds have had considerable investor interest during the past few years as an alternative investment, and there has been a tremendous flow of money into these funds. Managed futures and hedge funds typically charge 20-25% of gains for their investment services. These funds are usually only open to qualified investors (those with a net worth of $1M or more) and minimum investments of $500,000 or more is not uncommon. Managed futures broke their trend of lackluster performance for the past few years and did well due to strong commodity prices in 2007.
How did the FastBreak strategies posted on our web site perform? Note: the date in the table below indicates when the system was posted on our web site. In many cases the system was trading real time well before posting.
|
|
System Return%
|
MDD
|
UPI
|
|
Bond system (2/18/2002)
|
6.6
|
-4.2
|
-3.04
|
|
Growth w/RUTTR signal (2/18/2002)
|
-0.4
|
-7.7
|
-0.5
|
|
International funds (6/10/2002)
|
22.1
|
-10.3
|
4.7
|
|
Bonds LT Gov and HY (2/13/2003)
|
9.4
|
-3.4
|
6.7
|
|
Bonds Conservative zero coupon (2/13/2003)
|
11.0
|
-2.7
|
10.9
|
|
Bonds Aggressive zero coupon (2/13/2003)
|
10.1
|
-6.7
|
4.2
|
|
Juno only (shorts bonds) (2/13/2003)
|
-0.1
|
-6.2
|
-0.4
|
|
Arktos only (shorts OTC) (3/10/2003)
|
-0.4
|
-8.8
|
-0.9
|
|
Ursa only (shorts S&P) (3/10/2003)
|
1.1
|
-5.8
|
-0.3
|
|
Low beta Growth(w/RUTVOL signal) (3/10/2003)
|
4.5
|
-6.9
|
1.0
|
|
High beta Growth(w/RUTVOL signal) (3/10/2003)
|
0.1
|
-9.6
|
-0.4
|
|
Income Strategy (3/10/2003)
|
4.0
|
-2.4
|
2.0
|
|
Weak Dollar (1/17/2005)
|
5.3
|
-7.6
|
1.1
|
Bond systems were excellent and the system that trades more conservative zero coupon bond funds gave an excellent performance again this year. This same system returned nearly 12% in 2006. MDD was excellent for all systems. All the bond systems contain Treasury bond funds in their respective families and these funds performed very well late in the year as they became safe havens. The original bond system posted back in 2002 continues to perform well. This system has returned 68% in real time compared to 53% for the Shearson Treasury Bond Index (STBI-), and 45% for the DJ Bond Index (DJ-B2). The maximum drawdown has never exceeded 7.8%
The mid year sell off in bonds resulted in the Juno only system (Juno is the old name of the Rydex fund that shorts bonds) to briefly go short. This resulted in a small loss but the system quickly went back to cash when the market recovered.
The International system continued to have stellar performance. This same system was up 26% in 2006, 21% in 2005, 29% in 2004, 63% in 2003 and 30% in 2002. This has been a fantastic system returning in excess of 250% since 2002 (compared to less than 50% for the S&P); however, since the strategy was built in 2002 many of the funds have closed or incorporated short term redemption fees. The results do not reflect those fees. We have maintained reporting on this strategy to demonstrate long term strategy performance. We have developed international strategies that use closed-end country funds that we have reported on in previous years and again later in this report.
The Arktos and Ursa systems short the market (Old Rydex names for funds that short the OTC 100 and S&P 500). Without significant market sell offs both systems stayed in money market for the vast majority of the year. The systems went short during market weakness, but quickly went back to money market when the market recovered. We keep these systems in reserve when we have another 2001-2002 bear market. These systems could also be used to hedge long positions during market weakness.
The three growth systems that use the RUTTR and RUTVOL market timing signals did little in either direction. Both of these two market timing signals had excellent signals in 2006, but in 2007 they tended to get whipsawed. That is often the nature of market timing and the price to be paid to control risk. For example, the day this commentary is being written the market is down nearly 2% and these signals are comfortably in cash. These market timing signals have been very popular with the FastTrack investor community. We admire the excellent work that went into building these signals, and we built the trading systems to take advantage of signals. Since being posted in 2002 the system that uses the RUTTR signal has returned 58%, almost double the 33% of the S&P 500 while being in a cash position a large amount of the time. The Low Beta Growth system has equaled the S&P 500 since being posted, with much less volatility and being in cash during large periods of time. The High Beta system hasn’t been as consistent and we would declare it a poor system.
The Income strategy had a modest year and the first non double digit year since being developed in 2003. Since release in late 2003 this system has delivered over 70% in profit compared to less than 40% for the S&P. This strategy trades a variety of Fidelity bond and real estate funds with few trades per year. The system has one shortcoming and that is a lack of a Treasury bond fund in the trading family. The strategy was built before Fidelity offered Treasury bond funds. Fidelity now has short, intermediate and long term Treasury funds. It would seem reasonable to replace the FBIDX bond fund with the Fidelity short term Treasury fund FSBIX. Making this substitution the system would have returned over 6% in 2007.
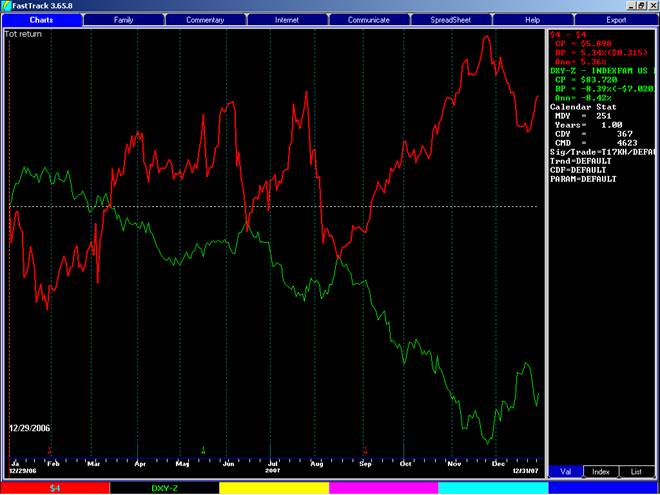
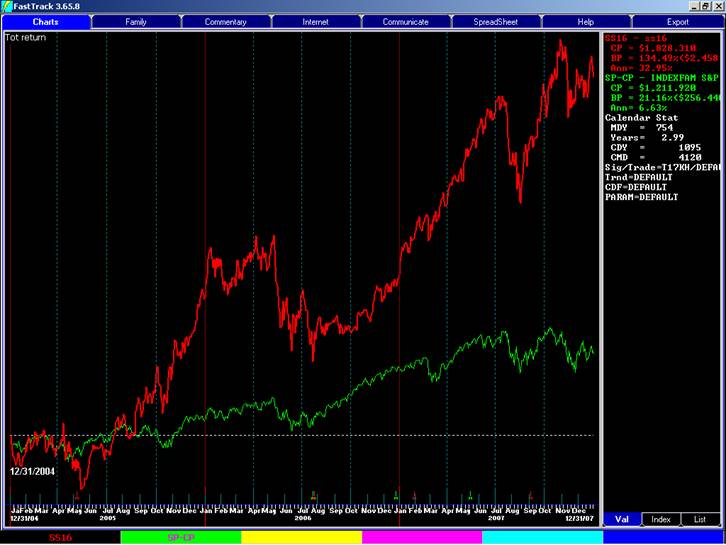
The Weak Dollar trading system had a good year. This system was built to take advantage of a falling US Dollar. See 2005 Commentary. As you can see below, this system (red line) traded as intended in a mirror fashion with the dollar index (green line).
Since building and posting this system both Rydex and ProFunds have released products that are a “pure” play on a weak or strong US dollar. The Rydex funds are especially interesting because they employ 2X leverage. We built and trade a system that trades a family containing Rydex’s strong and weak US dollar funds, along with their long & short bond funds. This system was built with the new V6 FastBreak Pro beta with trendlines. The system traded uses a trendline for a buy filter. We usually don’t talk about systems until they have at least a year of real time performance, but the system is showing good performance in real time and we want to show that there are alternatives to traditional stock and bond mutual funds. There is the added benefit that this system should have a low correlation with many other systems. Here is a chart showing the performance of the system (Red) to the S&P 500 (green) and the US Dollar Index (yellow).
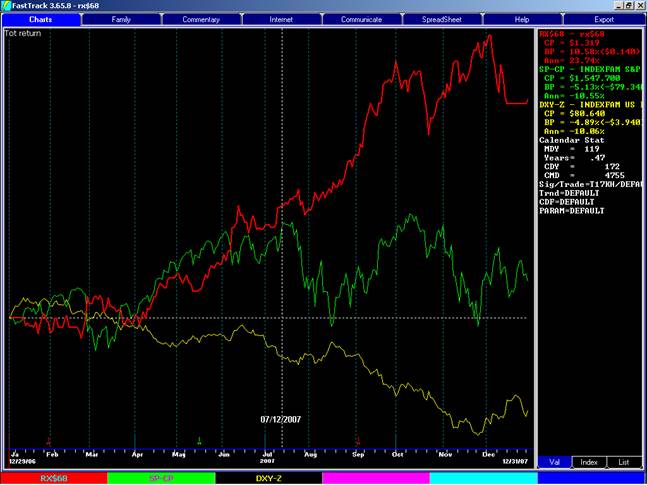
Real time performance since 7/12/2007 is over 10% compared to a loss of over 5% in the S&P.
Other Mutual Fund Systems of Interest
Potential FastBreak users often ask about other systems such as Rydex and Fidelity Sectors. Here are some other systems we traded or monitored during the full year to provide additional information. The trading files for these systems are not posted on our web site.
|
System
|
Return%
|
MDD%
|
UPI
|
|
Annuity (4 funds no signal)
|
-0.5
|
-11.2
|
-0.3
|
|
Rydex w/FastBreak signal
|
14.6
|
-12.6
|
2.4
|
|
Rydex no signal
|
12.0
|
-9.0
|
2.3
|
|
Select w/FastBreak signal
|
10.7
|
-15.2
|
1.5
|
|
Select no signal
|
18.6
|
-14.0
|
3.0
|
|
ProFunds (T17db signal)
|
17.2
|
-18.6
|
2.1
|
The annuity system holds four positions in a trading family of 45 funds. The trading family includes a very diverse group of funds including international and bond funds. This is the reoptomized strategy we referenced in the 2006 commentary. It was reoptimized due to annuity company changing many of their funds. One of the advantages of FastBreak Pro is the ability to quickly rebuild trading systems when there is significant change in investment program such as annuity or retirement programs. The system got whipsawed and finished the year down but coming back strong compared to the overall market. Trading versions of this strategy over the years has been very successful (see previous years commentaries) so we are willing to give it pass this year.
Rydex and Fidelity sector system performance was quite good. The FastBreak market timing signals generally did little for performance with the market starting to recover shortly after the signals gave sells. The ProFunds system is somewhat new. It was built in mid 2006 and uses the T17db signal. The T17db signal is a popular market timing signal in the FastTrack user community. The signal is based on the work of Dennis Meyers and modified by Don Bell. The signal can be determined using Ed Gilbert’s popular TRADE program. This system includes the ProFunds 2xBeta index fund along with the 1.5xBeta sector funds. It is extremely aggressive.
ETF Trading Systems
We ventured into ETF trading systems. ETFs are fantastic investment vehicles; unfortunately, there isn’t a lot of historical data for historical testing and system optimization. Some investors have successfully developed systems using other sector funds or indexes that have a long history and then substituting the ETFs into the system. We took the approach of simply including all the ETFs in the FastTrack database and optimizing over a period of time shorter than we generally like. We didn’t include any market timing signals because there are a variety of ETFs that go short. The system holds five ETFs. The system is performing well in real time. We believe ETFs will become the trading vehicle of choice as more historical data becomes available.
Stock Trading Systems
Review the 2005 and 2006 end of year commentaries that described stock trading systems built using FastBreak Pro. Trading individual stocks can produce spectacular returns or equally impressive failure.
The closed-end country fund (funds that trade like stocks) trading system that uses a specialized market timing signal was described in the 2005 Review, and 2006 was the first full year of trading for this system and it returned 53.7% with a 14% MDD. In 2007 the system had a more modest 8.5% return with a 12% MDD. This was respectable performance but disappointing after the 2006 returns. The closed-end system (that doesn’t use a timing signal) that we introduced in 2005 and had very good performance in 2005 and 2006 got whipsawed starting in the middle of 2007 and finished the year down 14%. We want to take another look at this strategy and see what went wrong because closed-end country funds are tremendous trading vehicles.
We have continued to investigate trading growth stocks. The past two years we have had mixed results; however, the large cap stock trading systems that had inconsistent performance in 2005 and 2006 had phenomenal performance in 2007 with returns of 30% to 95% for the year. Although this is outstanding, we are looking for consistent performance. Most of the 2007 performance was due to a few spectacular gains by a few select stocks, e.g., RIMM up over 160%. The strategies were able to find and take advantage of these moves. Below is an example of one of the systems (red line) over the past three years compared to the S&P 500 (green line). The FastBreak system is actually one of the worst systems but we use it to show and example of inconsistent performance.
The following table summarizes the results:
|
|
2005
|
2006
|
2007
|
Avg ann%
|
MDD
|
|
FastBreak System
|
38%
|
5%
|
61%
|
33%
|
-25
|
|
S&P 500
|
3%
|
13%
|
3%
|
6.6%
|
-10
|
Obviously over the long term the FastBreak system has excellent returns but how many investors would have stayed with the system after 2006 or the August 2007 drawdown?
We noted last year that we were investigating low beta value stocks. We used a family of 300 small cap value stocks from Morning Star. Unfortunately this was not the year to be in small cap or value stocks. The family average for the Morning Star family lost 17% during 2007 with an MDD of nearly 25%. At the end of 2006 we built a number of trading systems to use this family. We had several systems because we tried a variety of beta filters and momentum ranking methods. The returns ranged from 0 to 20% for the full year with MDDs generally around 15%. So the good news is that although the strategies had modest performance they outperformed the index by approximately 25% on average. Perhaps in a year that is favorable to value and small caps the performance will be outstanding. Also, it is well know that the market often rotates favor between value and growth, and large cap and small cap. Many investors try to identify which is in favor and then trade accordingly. We will keep you posted on future results.
Summary
In a year when the market was choppy and generally trendless FastBreak performance was generally good. The one message that we keep emphasizing is that investors should diversify across multiple trading systems and asset classes. No one system is going to trade well in all markets. In a choppy, trendless market like 2007 systems that use market timing tend to be whipsawed and under perform. That is the price often paid for risk control. However, as we entered a very bearish 2008 nearly all our trading systems were comfortably in cash, bonds or even short the market.
What is FastBreak and Who needs FastBreak
Unlike other trading methods, the FastBreak "mechanical" trading strategies gives specific buy and sell recommendations. Mechanical trading systems leave no room for historic "revision". These types of trading systems may not be for everyone, but we believe they should be considered if you recognize yourself in the following:
- Do you have trouble "pulling the trigger" on trades, e.g., selling your losers, taking profits on your winners, waiting for a bounce to get out of a bad trade ...?
- Do you have a limited amount of time to devote to your investments? If you are a full time investor, or enjoy sitting in front of CNBC and your computer all day, you may be able to do better with other investment methods. However, if you have limited time (or better things to do with your time!) a few minutes an evening is all you need to download your FastTrack data and run your FastBreak strategies.
- We have stopped reporting on some of the older FastBreak systems for a variety of reasons: Many of the mutual funds used in these old trading system families have since been discontinued, the market timing signals (unrelated to FastBreak) used did not stand the test of time, and we can build much more effective strategies with the functionality added to FastBreak in recent years. We felt that those systems don't accurately reflect the performance that FastBreak can produce.
Edge Ware, LLC.
Standard Disclaimer
As the saying goes, "Past performance is not a guarantee of future results."
l>